Time-Series Momentum
An asset's own past direction predicts its next move. Volatility-scale that signal across many markets and you get a diversified, risk-targeted trend-following strategy — implemented and backtested here.
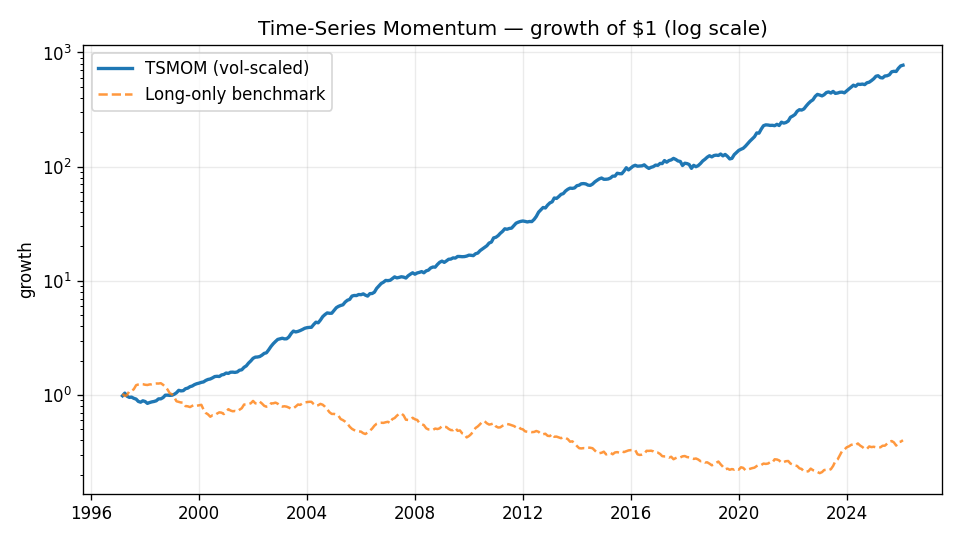
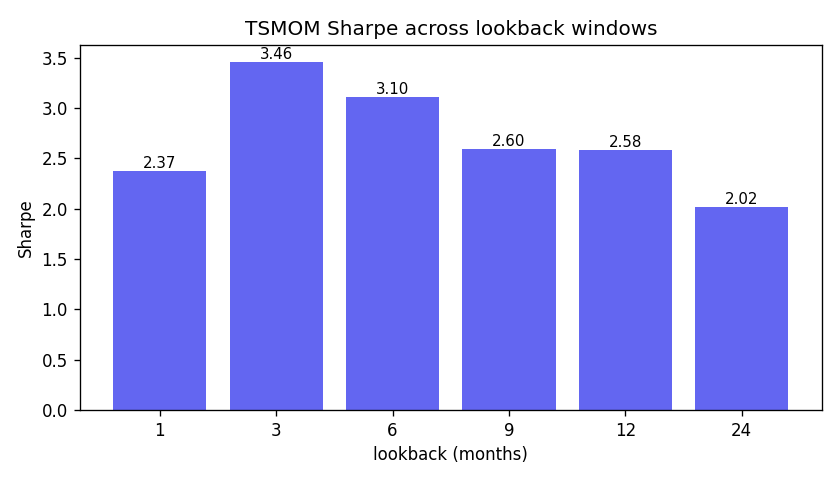
2.58
Sharpe (vs −0.27 long-only)
7.6
predictability t-stat
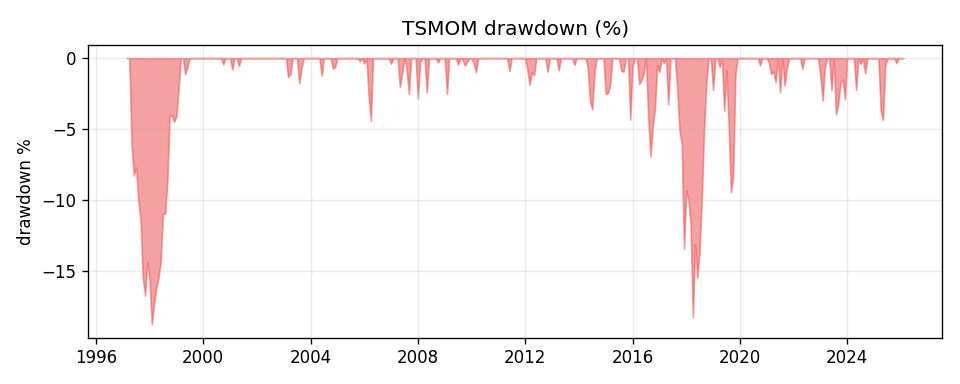
−18.7%
max drawdown (vs −83.7%)
75%
monthly hit rate
The backtest
Vol-scaled long/short positions, monthly rebalance, only past information used. Growth of $1 on a log scale:
The rule
signal   = sign(trailing 12-month return)      # +1 long / −1 short
position = signal × target_vol / ex_ante_vol   # equal risk per asset
return   = position × next-month return         # average across assets
Numbers above use synthetic data built with persistent trends, to show
the mechanism cleanly. Real markets are noisier — run tsmom --source live
to backtest on actual prices via yfinance.